|
Typedefs
typedef uint8_t lv_chart_type_t
typedef uint8_t lv_chart_update_mode_t
typedef uint8_t lv_chart_axis_t
Enums
enum [anonymous]
- Chart types Values:
- enumerator LV_CHART_TYPE_NONE
- Don't draw the series
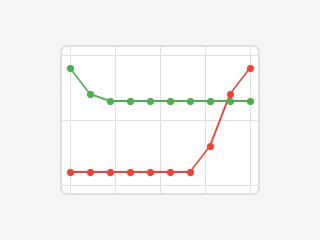
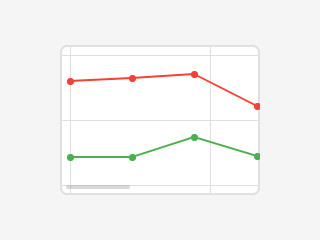
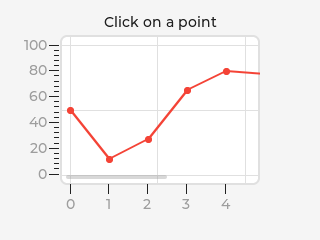
- enumerator LV_CHART_TYPE_LINE
- Connect the points with lines
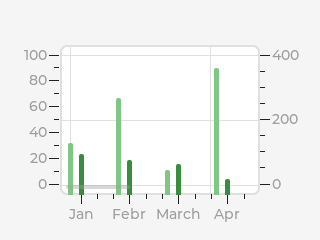
- enumerator LV_CHART_TYPE_BAR
- Draw columns
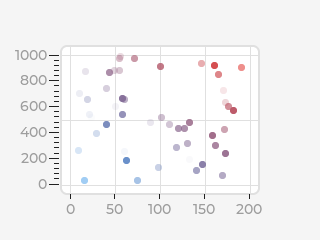
- enumerator LV_CHART_TYPE_SCATTER
- Draw points and lines in 2D (x,y coordinates)
enum [anonymous]
- Chart update mode for
lv_chart_set_next Values:
- enumerator LV_CHART_UPDATE_MODE_SHIFT
- Shift old data to the left and add the new one the right
- enumerator LV_CHART_UPDATE_MODE_CIRCULAR
- Add the new data in a circular way
enum [anonymous]
- Enumeration of the axis' Values:
- enumerator LV_CHART_AXIS_PRIMARY_Y
- enumerator LV_CHART_AXIS_SECONDARY_Y
- enumerator LV_CHART_AXIS_PRIMARY_X
- enumerator LV_CHART_AXIS_SECONDARY_X
- enumerator _LV_CHART_AXIS_LAST
enum lv_chart_draw_part_type_t
type field in lv_obj_draw_part_dsc_t if class_p = lv_chart_class Used in LV_EVENT_DRAW_PART_BEGIN and LV_EVENT_DRAW_PART_END Values:- enumerator LV_CHART_DRAW_PART_DIV_LINE_INIT
- Used before/after drawn the div lines
- enumerator LV_CHART_DRAW_PART_DIV_LINE_HOR
- Used for each horizontal division lines
- enumerator LV_CHART_DRAW_PART_DIV_LINE_VER
- Used for each vertical division lines
- enumerator LV_CHART_DRAW_PART_LINE_AND_POINT
- Used on line and scatter charts for lines and points
- enumerator LV_CHART_DRAW_PART_BAR
- Used on bar charts for the rectangles
- enumerator LV_CHART_DRAW_PART_CURSOR
- Used on cursor lines and points
- enumerator LV_CHART_DRAW_PART_TICK_LABEL
- Used on tick lines and labels
Functions
LV_EXPORT_CONST_INT(LV_CHART_POINT_NONE)
lv_obj_t *lv_chart_create(lv_obj_t *parent)
- Create a chart object
- Parameters
- parent -- pointer to an object, it will be the parent of the new chart
- Returns
- pointer to the created chart
void lv_chart_set_type(lv_obj_t *obj, lv_chart_type_t type)
- Set a new type for a chart
- Parameters
- obj -- pointer to a chart object
- type -- new type of the chart (from 'lv_chart_type_t' enum)
void lv_chart_set_point_count(lv_obj_t *obj, uint16_t cnt)
- Set the number of points on a data line on a chart
- Parameters
- obj -- pointer to a chart object
- cnt -- new number of points on the data lines
void lv_chart_set_range(lv_obj_t *obj, lv_chart_axis_t axis, lv_coord_t min, lv_coord_t max)
- Set the minimal and maximal y values on an axis
- Parameters
- obj -- pointer to a chart object
- axis --
LV_CHART_AXIS_PRIMARY_Y or LV_CHART_AXIS_SECONDARY_Y
- min -- minimum value of the y axis
- max -- maximum value of the y axis
void lv_chart_set_update_mode(lv_obj_t *obj, lv_chart_update_mode_t update_mode)
- Set update mode of the chart object. Affects
- Parameters
- obj -- pointer to a chart object
- mode -- the update mode
void lv_chart_set_div_line_count(lv_obj_t *obj, uint8_t hdiv, uint8_t vdiv)
- Set the number of horizontal and vertical division lines
- Parameters
- obj -- pointer to a chart object
- hdiv -- number of horizontal division lines
- vdiv -- number of vertical division lines
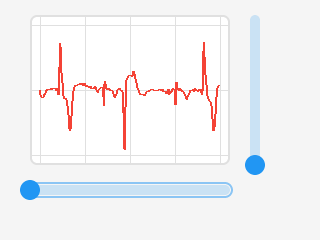
void lv_chart_set_zoom_x(lv_obj_t *obj, uint16_t zoom_x)
- Zoom into the chart in X direction
- Parameters
- obj -- pointer to a chart object
- zoom_x -- zoom in x direction. LV_ZOOM_NONE or 256 for no zoom, 512 double zoom
void lv_chart_set_zoom_y(lv_obj_t *obj, uint16_t zoom_y)
- Zoom into the chart in Y direction
- Parameters
- obj -- pointer to a chart object
- zoom_y -- zoom in y direction. LV_ZOOM_NONE or 256 for no zoom, 512 double zoom
uint16_t lv_chart_get_zoom_x(const lv_obj_t *obj)
- Get X zoom of a chart
- Parameters
- obj -- pointer to a chart object
- Returns
- the X zoom value
uint16_t lv_chart_get_zoom_y(const lv_obj_t *obj)
- Get Y zoom of a chart
- Parameters
- obj -- pointer to a chart object
- Returns
- the Y zoom value
void lv_chart_set_axis_tick(lv_obj_t *obj, lv_chart_axis_t axis, lv_coord_t major_len, lv_coord_t minor_len, lv_coord_t major_cnt, lv_coord_t minor_cnt, bool label_en, lv_coord_t draw_size)
- Set the number of tick lines on an axis
- Parameters
- obj -- pointer to a chart object
- axis -- an axis which ticks count should be set
- major_len -- length of major ticks
- minor_len -- length of minor ticks
- major_cnt -- number of major ticks on the axis
- minor_cnt -- number of minor ticks between two major ticks
- label_en -- true: enable label drawing on major ticks
- draw_size -- extra size required to draw the tick and labels (start with 20 px and increase if the ticks/labels are clipped)
lv_chart_type_t lv_chart_get_type(const lv_obj_t *obj)
- Get the type of a chart
- Parameters
- obj -- pointer to chart object
- Returns
- type of the chart (from 'lv_chart_t' enum)
uint16_t lv_chart_get_point_count(const lv_obj_t *obj)
- Get the data point number per data line on chart
- Parameters
- chart -- pointer to chart object
- Returns
- point number on each data line
uint16_t lv_chart_get_x_start_point(const lv_obj_t *obj, lv_chart_series_t *ser)
- Get the current index of the x-axis start point in the data array
- Parameters
- chart -- pointer to a chart object
- ser -- pointer to a data series on 'chart'
- Returns
- the index of the current x start point in the data array
void lv_chart_get_point_pos_by_id(lv_obj_t *obj, lv_chart_series_t *ser, uint16_t id, lv_point_t *p_out)
- Get the position of a point to the chart.
- Parameters
- chart -- pointer to a chart object
- ser -- pointer to series
- id -- the index.
- p_out -- store the result position here
void lv_chart_refresh(lv_obj_t *obj)
- Refresh a chart if its data line has changed
- Parameters
- chart -- pointer to chart object
lv_chart_series_t *lv_chart_add_series(lv_obj_t *obj, lv_color_t color, lv_chart_axis_t axis)
- Allocate and add a data series to the chart
- Parameters
- obj -- pointer to a chart object
- color -- color of the data series
- axis -- the y axis to which the series should be attached (::LV_CHART_AXIS_PRIMARY_Y or ::LV_CHART_AXIS_SECONDARY_Y)
- Returns
- pointer to the allocated data series
void lv_chart_remove_series(lv_obj_t *obj, lv_chart_series_t *series)
- Deallocate and remove a data series from a chart
- Parameters
- chart -- pointer to a chart object
- series -- pointer to a data series on 'chart'
void lv_chart_hide_series(lv_obj_t *chart, lv_chart_series_t *series, bool hide)
- Hide/Unhide a single series of a chart.
- Parameters
- obj -- pointer to a chart object.
- series -- pointer to a series object
- hide -- true: hide the series
void lv_chart_set_series_color(lv_obj_t *chart, lv_chart_series_t *series, lv_color_t color)
- Change the color of a series
- Parameters
- obj -- pointer to a chart object.
- series -- pointer to a series object
- color -- the new color of the series
void lv_chart_set_x_start_point(lv_obj_t *obj, lv_chart_series_t *ser, uint16_t id)
- Set the index of the x-axis start point in the data array. This point will be considers the first (left) point and the other points will be drawn after it.
- Parameters
- obj -- pointer to a chart object
- ser -- pointer to a data series on 'chart'
- id -- the index of the x point in the data array
lv_chart_series_t *lv_chart_get_series_next(const lv_obj_t *chart, const lv_chart_series_t *ser)
- Get the next series.
- Parameters
- chart -- pointer to a chart
- ser -- the previous series or NULL to get the first
- Returns
- the next series or NULL if there is no more.
lv_chart_cursor_t *lv_chart_add_cursor(lv_obj_t *obj, lv_color_t color, lv_dir_t dir)
- Add a cursor with a given color
- Parameters
- obj -- pointer to chart object
- color -- color of the cursor
- dir -- direction of the cursor.
LV_DIR_RIGHT/LEFT/TOP/DOWN/HOR/VER/ALL. OR-ed values are possible
- Returns
- pointer to the created cursor
void lv_chart_set_cursor_pos(lv_obj_t *chart, lv_chart_cursor_t *cursor, lv_point_t *pos)
- Set the coordinate of the cursor with respect to the paddings
- Parameters
- obj -- pointer to a chart object
- cursor -- pointer to the cursor
- pos -- the new coordinate of cursor relative to the chart
void lv_chart_set_cursor_point(lv_obj_t *chart, lv_chart_cursor_t *cursor, lv_chart_series_t *ser, uint16_t point_id)
- Stick the cursor to a point
- Parameters
- obj -- pointer to a chart object
- cursor -- pointer to the cursor
- ser -- pointer to a series
- point_id -- the point's index or
LV_CHART_POINT_NONE to not assign to any points.
lv_point_t lv_chart_get_cursor_point(lv_obj_t *chart, lv_chart_cursor_t *cursor)
- Get the coordinate of the cursor with respect to the paddings
- Parameters
- obj -- pointer to a chart object
- cursor -- pointer to cursor
- Returns
- coordinate of the cursor as lv_point_t
void lv_chart_set_all_value(lv_obj_t *obj, lv_chart_series_t *ser, lv_coord_t value)
- Initialize all data points of a series with a value
- Parameters
- obj -- pointer to chart object
- ser -- pointer to a data series on 'chart'
- value -- the new value for all points.
LV_CHART_POINT_NONE can be used to hide the points.
void lv_chart_set_next_value(lv_obj_t *obj, lv_chart_series_t *ser, lv_coord_t value)
- Set the next point's Y value according to the update mode policy.
- Parameters
- obj -- pointer to chart object
- ser -- pointer to a data series on 'chart'
- value -- the new value of the next data
void lv_chart_set_next_value2(lv_obj_t *obj, lv_chart_series_t *ser, lv_coord_t x_value, lv_coord_t y_value)
- Set the next point's X and Y value according to the update mode policy.
- Parameters
- obj -- pointer to chart object
- ser -- pointer to a data series on 'chart'
- x_value -- the new X value of the next data
- y_value -- the new Y value of the next data
void lv_chart_set_value_by_id(lv_obj_t *obj, lv_chart_series_t *ser, uint16_t id, lv_coord_t value)
- Set an individual point's y value of a chart's series directly based on its index
- Parameters
- obj -- pointer to a chart object
- ser -- pointer to a data series on 'chart'
- id -- the index of the x point in the array
- value -- value to assign to array point
void lv_chart_set_value_by_id2(lv_obj_t *obj, lv_chart_series_t *ser, uint16_t id, lv_coord_t x_value, lv_coord_t y_value)
- Set an individual point's x and y value of a chart's series directly based on its index Can be used only with
LV_CHART_TYPE_SCATTER.
- Parameters
- obj -- pointer to chart object
- ser -- pointer to a data series on 'chart'
- id -- the index of the x point in the array
- x_value -- the new X value of the next data
- y_value -- the new Y value of the next data
void lv_chart_set_ext_y_array(lv_obj_t *obj, lv_chart_series_t *ser, lv_coord_t array[])
- Set an external array for the y data points to use for the chart NOTE: It is the users responsibility to make sure the
point_cnt matches the external array size.
- Parameters
- obj -- pointer to a chart object
- ser -- pointer to a data series on 'chart'
- array -- external array of points for chart
void lv_chart_set_ext_x_array(lv_obj_t *obj, lv_chart_series_t *ser, lv_coord_t array[])
- Set an external array for the x data points to use for the chart NOTE: It is the users responsibility to make sure the
point_cnt matches the external array size.
- Parameters
- obj -- pointer to a chart object
- ser -- pointer to a data series on 'chart'
- array -- external array of points for chart
lv_coord_t *lv_chart_get_y_array(const lv_obj_t *obj, lv_chart_series_t *ser)
- Get the array of y values of a series
- Parameters
- obj -- pointer to a chart object
- ser -- pointer to a data series on 'chart'
- Returns
- the array of values with 'point_count' elements
lv_coord_t *lv_chart_get_x_array(const lv_obj_t *obj, lv_chart_series_t *ser)
- Get the array of x values of a series
- Parameters
- obj -- pointer to a chart object
- ser -- pointer to a data series on 'chart'
- Returns
- the array of values with 'point_count' elements
uint32_t lv_chart_get_pressed_point(const lv_obj_t *obj)
- Get the index of the currently pressed point. It's the same for every series.
- Parameters
- obj -- pointer to a chart object
- Returns
- the index of the point [0 .. point count] or LV_CHART_POINT_ID_NONE if no point is being pressed
Variables
const lv_obj_class_t lv_chart_class
struct lv_chart_series_t
- #include <lv_chart.h'> Descriptor a chart series Public Members
- lv_coord_t *x_points
- lv_coord_t *y_points
- lv_color_t color
- uint16_t start_point
- uint8_t hidden
- uint8_t x_ext_buf_assigned
- uint8_t y_ext_buf_assigned
- uint8_t x_axis_sec
- uint8_t y_axis_sec
struct lv_chart_cursor_t
- Public Members
- lv_point_t pos
- uint16_t point_id
- lv_color_t color
- lv_chart_series_t *ser
- lv_dir_t dir
- uint8_t pos_set
struct lv_chart_tick_dsc_t
- Public Members
- lv_coord_t major_len
- lv_coord_t minor_len
- lv_coord_t draw_size
- uint32_t minor_cnt
- uint32_t major_cnt
- uint32_t label_en
struct lv_chart_t
- Public Members
- lv_obj_t obj
- lv_ll_t series_ll
- Linked list for the series (stores lv_chart_series_t)
- lv_ll_t cursor_ll
- Linked list for the cursors (stores lv_chart_cursor_t)
- lv_chart_tick_dsc_t tick[4]
- lv_coord_t ymin[2]
- lv_coord_t ymax[2]
- lv_coord_t xmin[2]
- lv_coord_t xmax[2]
- uint16_t pressed_point_id
- uint16_t hdiv_cnt
- Number of horizontal division lines
- uint16_t vdiv_cnt
- Number of vertical division lines
- uint16_t point_cnt
- Point number in a data line
- uint16_t zoom_x
- uint16_t zoom_y
- lv_chart_type_t type
- Line or column chart
- lv_chart_update_mode_t update_mode
|
Typedefs
typedef uint8_t lv_chart_type_t
typedef uint8_t lv_chart_update_mode_t
typedef uint8_t lv_chart_axis_t
Enums
enum [anonymous]
- Chart types Values:
- enumerator LV_CHART_TYPE_NONE
- 系列を描画しない
- enumerator LV_CHART_TYPE_LINE
- 点を直線で接続します
- enumerator LV_CHART_TYPE_BAR
- 列を描画する
- enumerator LV_CHART_TYPE_SCATTER
- 2D(x、y座標)で点と線を描画します
enum [anonymous]
lv_chart_set_next のチャート更新モードValues:- enumerator LV_CHART_UPDATE_MODE_SHIFT
- 古いデータを左に移動し、新しいデータを右に追加する
- enumerator LV_CHART_UPDATE_MODE_CIRCULAR
- 新しいデータを循環的に追加する
enum [anonymous]
- 軸の値の列挙。
- enumerator LV_CHART_AXIS_PRIMARY_Y
- enumerator LV_CHART_AXIS_SECONDARY_Y
- enumerator LV_CHART_AXIS_PRIMARY_X
- enumerator LV_CHART_AXIS_SECONDARY_X
- enumerator _LV_CHART_AXIS_LAST
enum lv_chart_draw_part_type_t
type field in lv_obj_draw_part_dsc_t if class_p = lv_chart_class Used in LV_EVENT_DRAW_PART_BEGIN and LV_EVENT_DRAW_PART_END Values:- enumerator LV_CHART_DRAW_PART_DIV_LINE_INIT
- div線を引く前/後に使用
- enumerator LV_CHART_DRAW_PART_DIV_LINE_HOR
- 各水平分割線に使用
- enumerator LV_CHART_DRAW_PART_DIV_LINE_VER
- 各垂直分割線に使用
- enumerator LV_CHART_DRAW_PART_LINE_AND_POINT
- 線と点の線図と散布図で使用されます
- enumerator LV_CHART_DRAW_PART_BAR
- 長方形の棒グラフで使用されます
- enumerator LV_CHART_DRAW_PART_CURSOR
- カーソルラインとポイントで使用されます
- enumerator LV_CHART_DRAW_PART_TICK_LABEL
- 目盛りとラベルに使用
Functions
LV_EXPORT_CONST_INT(LV_CHART_POINT_NONE)
lv_obj_t *lv_chart_create(lv_obj_t *parent)
- チャートオブジェクトを作成する
- Parameters
- parent -- オブジェクトへのポインタ、それは新しいチャートの親になります
- Returns
- 作成されたチャートへのポインタ
void lv_chart_set_type(lv_obj_t *obj, lv_chart_type_t type)
- グラフの新しいタイプを設定する
- Parameters
- obj -- チャートオブジェクトへのポインタ
- type -- チャートの新しいタイプ('lv_chart_type_t'列挙型から)
void lv_chart_set_point_count(lv_obj_t *obj, uint16_t cnt)
- チャートのデータライン上のポイント数を設定します
- Parameters
- obj -- チャートオブジェクトへのポインタ
- cnt -- データライン上の新しいポイント数
void lv_chart_set_range(lv_obj_t *obj, lv_chart_axis_t axis, lv_coord_t min, lv_coord_t max)
- Set the minimal and maximal y values on an axis
- Parameters
- obj -- チャートオブジェクトへのポインタ
- axis --
LV_CHART_AXIS_PRIMARY_Y または LV_CHART_AXIS_SECONDARY_Y
- min -- y軸の最小値
- max -- y軸の最大値
void lv_chart_set_update_mode(lv_obj_t *obj, lv_chart_update_mode_t update_mode)
- チャートオブジェクトの更新モードを設定します。 影響
- Parameters
- obj -- チャートオブジェクトへのポインタ
- mode -- 更新モード
void lv_chart_set_div_line_count(lv_obj_t *obj, uint8_t hdiv, uint8_t vdiv)
- 水平分割線と垂直分割線の数を設定します
- Parameters
- obj -- チャートオブジェクトへのポインタ
- hdiv -- 水平分割線の数
- vdiv -- 垂直分割線の数
void lv_chart_set_zoom_x(lv_obj_t *obj, uint16_t zoom_x)
- チャートをX方向に拡大します
- Parameters
- obj -- チャートオブジェクトへのポインタ
- zoom_x -- x方向にズームインします。 LV_ZOOM_NONEまたは256(ズームなし)、512ダブルズーム
void lv_chart_set_zoom_y(lv_obj_t *obj, uint16_t zoom_y)
- チャートをY方向に拡大します
- Parameters
- obj -- チャートオブジェクトへのポインタ
- zoom_y -- y方向にズームインします。 LV_ZOOM_NONEまたは256(ズームなし)、512ダブルズーム
uint16_t lv_chart_get_zoom_x(const lv_obj_t *obj)
- チャートのXズームを取得
- Parameters
- obj -- チャートオブジェクトへのポインタ
- Returns
- Xズーム値
uint16_t lv_chart_get_zoom_y(const lv_obj_t *obj)
- チャートのYズームを取得
- Parameters
- obj -- チャートオブジェクトへのポインタ
- Returns
- Yズーム値
void lv_chart_set_axis_tick(lv_obj_t *obj, lv_chart_axis_t axis, lv_coord_t major_len, lv_coord_t minor_len, lv_coord_t major_cnt, lv_coord_t minor_cnt, bool label_en, lv_coord_t draw_size)
- 軸上の目盛りの数を設定します
- Parameters
- obj -- チャートオブジェクトへのポインタ
- axis -- カウントを刻む軸を設定する必要があります
- major_len -- 主軸の長さ
- minor_len -- 副軸の長さ
- major_cnt -- 軸上の主要な目盛りの数
- minor_cnt -- 2つの主軸の間の副軸の数
- label_en -- true:メジャーティックでのラベル描画を有効にします
- draw_size -- ティックとラベルを描画するために必要な追加のサイズ(20ピクセルから開始し、ティック/ラベルがクリップされている場合は増加します)
lv_chart_type_t lv_chart_get_type(const lv_obj_t *obj)
- グラフの種類を取得する
- Parameters
- obj -- チャートオブジェクトへのポインタ
- Returns
- チャートのタイプ('lv_chart_t'列挙型から)
uint16_t lv_chart_get_point_count(const lv_obj_t *obj)
- チャート上のデータラインごとのデータポイント番号を取得します
- Parameters
- chart -- チャートオブジェクトへのポインタ
- Returns
- 各データラインのポイント番号
uint16_t lv_chart_get_x_start_point(const lv_obj_t *obj, lv_chart_series_t *ser)
- データ配列のx軸開始点の現在のインデックスを取得します
- Parameters
- chart -- チャートオブジェクトへのポインタ
- ser -- 'チャート'上のデータ系列へのポインタ
- Returns
- データ配列内の現在のx開始点のインデックス
void lv_chart_get_point_pos_by_id(lv_obj_t *obj, lv_chart_series_t *ser, uint16_t id, lv_point_t *p_out)
- チャートへのポイントの位置を取得します。
- Parameters
- chart -- pointer to a chart object
- ser -- シリーズへのポインタ
- id --インデックス。
- p_out -- 結果の位置をここに保存します
void lv_chart_refresh(lv_obj_t *obj)
- データ行が変更された場合は、グラフを更新します
- Parameters
- chart -- チャートオブジェクトへのポインタ
lv_chart_series_t *lv_chart_add_series(lv_obj_t *obj, lv_color_t color, lv_chart_axis_t axis)
- データ系列を割り当ててグラフに追加します
- Parameters
- obj -- チャートオブジェクトへのポインタ
- color -- データ系列の色
- axis --シリーズを接続するy軸 (::LV_CHART_AXIS_PRIMARY_Y or ::LV_CHART_AXIS_SECONDARY_Y)
- Returns
- 割り当てられたデータ系列へのポインタ
void lv_chart_remove_series(lv_obj_t *obj, lv_chart_series_t *series)
- グラフからデータ系列の割り当てを解除して削除します
- Parameters
- chart -- チャートオブジェクトへのポインタ
- series -- 'チャート'上のデータ系列へのポインタ
void lv_chart_hide_series(lv_obj_t *chart, lv_chart_series_t *series, bool hide)
- チャートの単一のシリーズを非表示/再表示します。
- Parameters
- obj -- チャートオブジェクトへのポインタ。
- series --系列オブジェクトへのポインタ
- hide -- true:シリーズを非表示にする
void lv_chart_set_series_color(lv_obj_t *chart, lv_chart_series_t *series, lv_color_t color)
- Change the color of a series
- Parameters
- obj --チャートオブジェクトへのポインタ。
- series --系列オブジェクトへのポインタ
- color --シリーズの新色
void lv_chart_set_x_start_point(lv_obj_t *obj, lv_chart_series_t *ser, uint16_t id)
- データ配列にx軸の始点のインデックスを設定します。 このポイントは最初の(左)ポイントと見なされ、他のポイントはその後に描画されます。
- Parameters
- obj -- チャートオブジェクトへのポインタ
- ser -- 'チャート'上のデータ系列へのポインタ
- id --データ配列内のxポイントのインデックス
lv_chart_series_t *lv_chart_get_series_next(const lv_obj_t *chart, const lv_chart_series_t *ser)
- 次のシリーズを入手してください。
- Parameters
- chart -- チャートへのポインタ
- ser -- 前のシリーズ、または最初のシリーズを取得するにはNULL
- Returns
- 次のシリーズ、またはそれ以上ない場合はNULL。
lv_chart_cursor_t *lv_chart_add_cursor(lv_obj_t *obj, lv_color_t color, lv_dir_t dir)
- 指定された色のカーソルを追加します
- Parameters
- obj -- チャートオブジェクトへのポインタ
- color -- カーソルの色
- dir --カーソルの方向。
LV_DIR_RIGHT/LEFT/TOP/DOWN/HOR/VER/ALL. OR-ed値が可能です
- Returns
- 作成されたカーソルへのポインタ
void lv_chart_set_cursor_pos(lv_obj_t *chart, lv_chart_cursor_t *cursor, lv_point_t *pos)
- パディングを基準としたカーソルの座標を設定する
- Parameters
- obj -- チャートオブジェクトへのポインタ
- cursor -- カーソルへのポインタ
- pos -- チャートを基準にしたカーソルの新しい座標
void lv_chart_set_cursor_point(lv_obj_t *chart, lv_chart_cursor_t *cursor, lv_chart_series_t *ser, uint16_t point_id)
- カーソルをポイントに固定します
- Parameters
- obj -- pointer to a chart object
- cursor -- カーソルへのポインタ
- ser -- シリーズへのポインタ
- point_id -- 点のインデックスを指定するか、または
LV_CHART_POINT_NONE を指定すると、どの点にも割り当てられません。
lv_point_t lv_chart_get_cursor_point(lv_obj_t *chart, lv_chart_cursor_t *cursor)
- カーソルのパディングに対する座標を取得する
- Parameters
- obj -- チャートオブジェクトへのポインタ
- cursor -- カーソルへのポインタ
- Returns
- カーソルの座標(lv_point_t).
void lv_chart_set_all_value(lv_obj_t *obj, lv_chart_series_t *ser, lv_coord_t value)
- シリーズのすべてのデータポイントを値で初期化する
- Parameters
- obj -- チャートオブジェクトへのポインタ
- ser -- chart' のデータ系列へのポインタ。
- value --すべてのポイントの新しい値。
LV_CHART_POINT_NONE を使用して、点を非表示にできます。
void lv_chart_set_next_value(lv_obj_t *obj, lv_chart_series_t *ser, lv_coord_t value)
- 更新モードポリシーに従って、次のポイントのY値を設定します。
- Parameters
- obj -- グラフオブジェクトへのポインタ
- ser -- 'グラフ'のデータ系列へのポインタ
- value -- 次のデータの新しい値
void lv_chart_set_next_value2(lv_obj_t *obj, lv_chart_series_t *ser, lv_coord_t x_value, lv_coord_t y_value)
- 更新モードポリシーに従って、次のポイントのXとYの値を設定します。
- Parameters
- obj -- グラフオブジェクトへのポインタ
- ser -- 'グラフ'のデータ系列へのポインタ
- x_value -- 次のデータの新しいX値
- y_value -- 次のデータの新しいY値
void lv_chart_set_value_by_id(lv_obj_t *obj, lv_chart_series_t *ser, uint16_t id, lv_coord_t value)
- グラフの系列の個々のポイントのy値をインデックスに基づいて直接設定する
- Parameters
- obj -- グラフオブジェクトへのポインタ
- ser -- 'グラフ'のデータ系列へのポインタ
- id -- 配列のx点のインデックス
- value -- 配列複写の点に代入する値
void lv_chart_set_value_by_id2(lv_obj_t *obj, lv_chart_series_t *ser, uint16_t id, lv_coord_t x_value, lv_coord_t y_value)
- グラフの系列の個々のポイントのx値とy値をインデックスに基づいて直接設定する
LV_CHART_TYPE_SCATTERと共にのみ使用できます。
- Parameters
- obj -- チャートオブジェクトへのポインタ
- ser -- 'チャート'上のデータ系列へのポインタ
- id -- 配列内のxポイントのインデックス
- x_value -- 次のデータの新しいX値
- y_value -- 次のデータの新しいY値
void lv_chart_set_ext_y_array(lv_obj_t *obj, lv_chart_series_t *ser, lv_coord_t array[])
- グラフに使用するyデータポイントの外部配列を設定します注:point_cntが外部配列のサイズと一致することを確認するのはユーザーの責任です。
- Parameters
- obj -- チャートオブジェクトへのポインタ
- ser -- pointer to a data series on 'chart'
- array -- チャートのポイントの外部配列
void lv_chart_set_ext_x_array(lv_obj_t *obj, lv_chart_series_t *ser, lv_coord_t array[])
- グラフに使用するxデータポイントの外部配列を設定します注:point_cntが外部配列のサイズと一致することを確認するのはユーザーの責任です。
- Parameters
- obj -- チャートオブジェクトへのポインタ
- ser -- 'チャート'上のデータ系列へのポインタ
- array -- チャートのポイントの外部配列
lv_coord_t *lv_chart_get_y_array(const lv_obj_t *obj, lv_chart_series_t *ser)
- 系列のy値の配列を取得します
- Parameters
- obj -- チャートオブジェクトへのポインタ
- ser -- 'チャート'上のデータ系列へのポインタ
- Returns
- 'point_count'要素を持つ値の配列
lv_coord_t *lv_chart_get_x_array(const lv_obj_t *obj, lv_chart_series_t *ser)
- 系列のx値の配列を取得します
- Parameters
- obj -- チャートオブジェクトへのポインタ
- ser -- 'チャート'上のデータ系列へのポインタ
- Returns
- 'point_count'要素を持つ値の配列
uint32_t lv_chart_get_pressed_point(const lv_obj_t *obj)
- 現在押されているポイントのインデックスを取得します。 それはすべてのシリーズで同じです。
- Parameters
- obj -- チャートオブジェクトへのポインタ
- Returns
- 点のインデックス [0 ... 点数] または、点が押されていない場合は LV_CHART_POINT_ID_NONE を指定します。
Variables
const lv_obj_class_t lv_chart_class
struct lv_chart_series_t
- #include <lv_chart.h'> Descriptor a chart series Public Members
- lv_coord_t *x_points
- lv_coord_t *y_points
- lv_color_t color
- uint16_t start_point
- uint8_t hidden
- uint8_t x_ext_buf_assigned
- uint8_t y_ext_buf_assigned
- uint8_t x_axis_sec
- uint8_t y_axis_sec
struct lv_chart_cursor_t
- Public Members
- lv_point_t pos
- uint16_t point_id
- lv_color_t color
- lv_chart_series_t *ser
- lv_dir_t dir
- uint8_t pos_set
struct lv_chart_tick_dsc_t
- Public Members
- lv_coord_t major_len
- lv_coord_t minor_len
- lv_coord_t draw_size
- uint32_t minor_cnt
- uint32_t major_cnt
- uint32_t label_en
struct lv_chart_t
- Public Members
- lv_obj_t obj
- lv_ll_t series_ll
- シリーズのリンクリスト(lv_chart_series_tが格納される)
- lv_ll_t cursor_ll
- カーソルのリンクリスト(lv_chart_cursor_t を格納する).
- lv_chart_tick_dsc_t tick[4]
- lv_coord_t ymin[2]
- lv_coord_t ymax[2]
- lv_coord_t xmin[2]
- lv_coord_t xmax[2]
- uint16_t pressed_point_id
- uint16_t hdiv_cnt
- 水平分割線数
- uint16_t vdiv_cnt
- 垂直分割線の数
- uint16_t point_cnt
- データライン内のポイント番号
- uint16_t zoom_x
- uint16_t zoom_y
- lv_chart_type_t type
- ラインチャート、コラムチャート
- lv_chart_update_mode_t update_mode
|
